Choosing election graphics software for broadcast comes down to seven things: how it ingests data, how it performs under real-time load, how interactive it is on air, how fast it deploys, how it performs on election night, how redundant it is, and what its cost model actually looks like.
Get those right and the platform holds up when results start moving fast. Get them wrong, and you find out live, in front of a primetime audience.
Election graphics software takes results as they arrive, from electoral commissions, wire services, and polling data, and turns them into the maps, tickers, and interactive visuals a correspondent uses on air.
In practice, it means ingesting dozens or hundreds of live feeds, reconciling different reporting formats and tabulation methods, and rendering all of it into something a presenter can navigate from a national map down to an individual local district without a delay the audience can feel.
The following seven criteria are what separate platforms that clear it from platforms that don't.
1. Data ingestion breadth.
How many live sources can the platform pull from simultaneously, and how well does it reconcile results that arrive in different formats from different authorities? A platform that can’t manage multiple feed formats will struggle the moment a race pulls from multiple regional or local reporting systems at once.
2. Real-time performance under load.
Ingestion is only half the story. The platform also has to render and update visuals fast enough that what's on screen matches what just happened, even as the volume of updates spikes.
3. On-air interactivity and telestration.
Can correspondents move between national, regional, and local views themselves, in real time, using touch or telestration? Or does every adjustment require a production team member behind the scenes? The difference shows up as either fluid storytelling or visible lag.
4. Deployment and lead time.
How long from signed contract to broadcast-ready? This is as much a project-management question as a technical one, and it determines how much runway a broadcast operations team actually has before a race.
5. Election-night performance.
Election demand isn't flat. It climbs through primary nights and early results and peaks hardest in the closing hours of the general. The platform needs to absorb that climb without requiring new hardware provisioned in advance.
6. Redundancy and failover.
What happens when a data source lags, a feed drops, or a system component fails mid-broadcast? Ask specifically how the platform is stress-tested before air, not just what its uptime claim is.
7. Cost model.
Is the pricing structure tied to infrastructure a broadcaster has to own and maintain, or to usage that scales with actual election activity? This shapes total cost of ownership far more than the sticker price of any single contract.
Much of the friction in evaluating election graphics platforms comes down to one underlying question: is the system's performance tied to specific hardware in a specific location, or not?
Legacy, on-prem systems mean dedicated servers procured and maintained at each broadcast site, with updates and patches managed locally market by market. It also ties the team to a place — if the servers live in one building, that's where election-night production has to happen.
Cloud-native systems centralize ingestion and processing, which removes that tie to any single machine or location. Updates ship centrally instead of site-by-site, and correspondents, producers, and operations teams can access and report from it from anywhere, not just from one specific control room.
IK Election Insights ingests real-time data from hundreds of live sources and renders it across national, regional, and local boundary views: state, county, or electorate lines, depending on the market.
Correspondents interact with results directly on air, through touch, telestration, and live navigation between views without routing through a production team, alongside purpose-built tools like Build-a-Government coalition modeling and Road-to-Victory pathway analysis.
The platform is broadcast-ready in as little as four weeks from signature, running on cloud-native architecture that is browser-based and enables teams to report from anywhere.
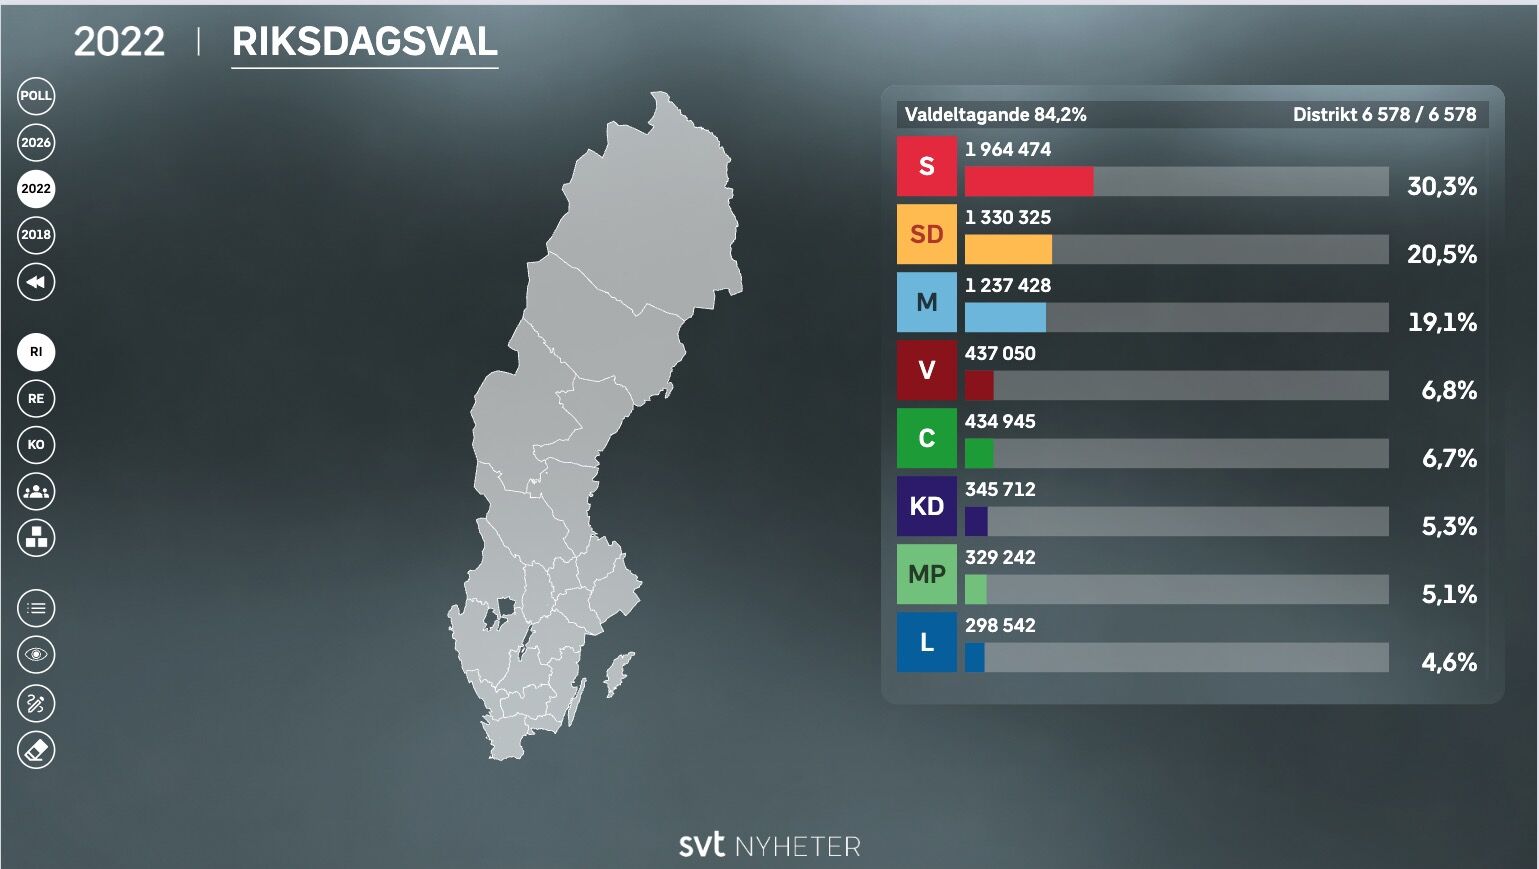
Updates and security patches ship automatically with built-in redundancy, and InterKnowlogy runs full live dress rehearsals with broadcasters ahead of election night. That process has held up under real pressure: SVT's 2022 Swedish election ran three simultaneous elections across more than 6,000 reporting districts without a hiccup.
IK Election Insights is also transactable on Azure Marketplace and MACC-eligible, which can simplify procurement for broadcasters already working within a Microsoft agreement.
Book a demo of IK Election Insights to see what it looks like for your newsroom.
How long before an election should you choose a platform? Deployment itself can take as little as four weeks. Data-feed contracts, specific configurations, and correspondent rehearsals all take additional lead time. Most broadcast ops teams are better served starting the evaluation earlier rather than racing the deployment clock.
What data feeds matter most? Official results from electoral commissions and news-agency results services are the backbone, but broadcasters also draw on polling data and, in some cases, custom or proprietary feeds. The platform's ability to reconcile multiple feed types — not just ingest one — is what determines how it holds up on a contested or fast-moving night.
Does the platform require a dedicated control room, or can teams work from anywhere? Because IK Election Insights is cloud-native, correspondents, producers, and operations teams can access and report from it from anywhere with a secure connection, not just from a specific building or control room. That's a meaningful shift from legacy systems, where production is tied to wherever the hardware lives.
.png)