What is data visualization?
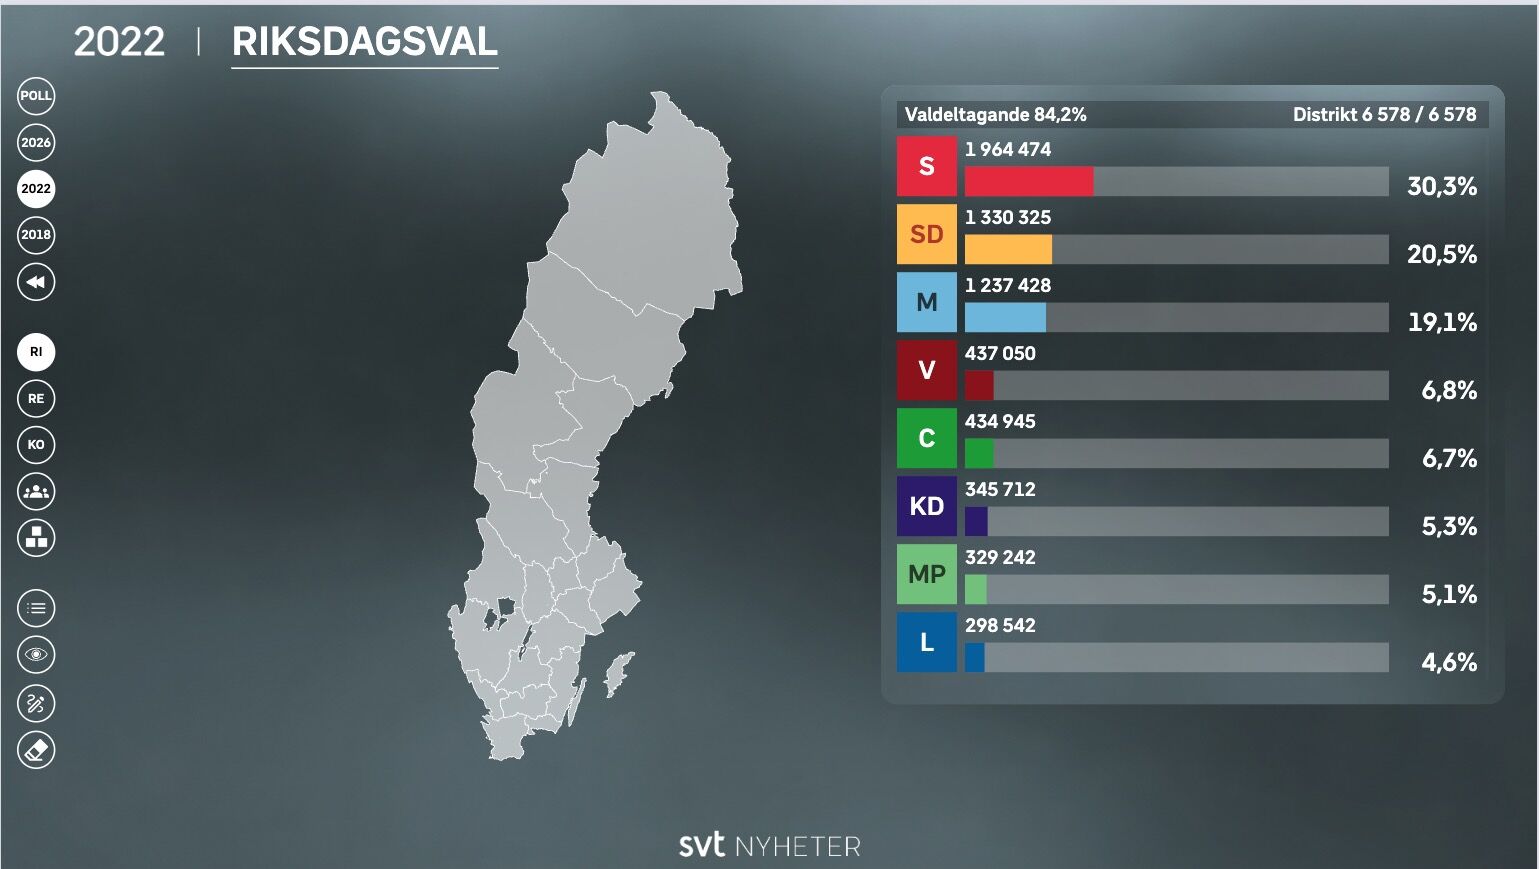
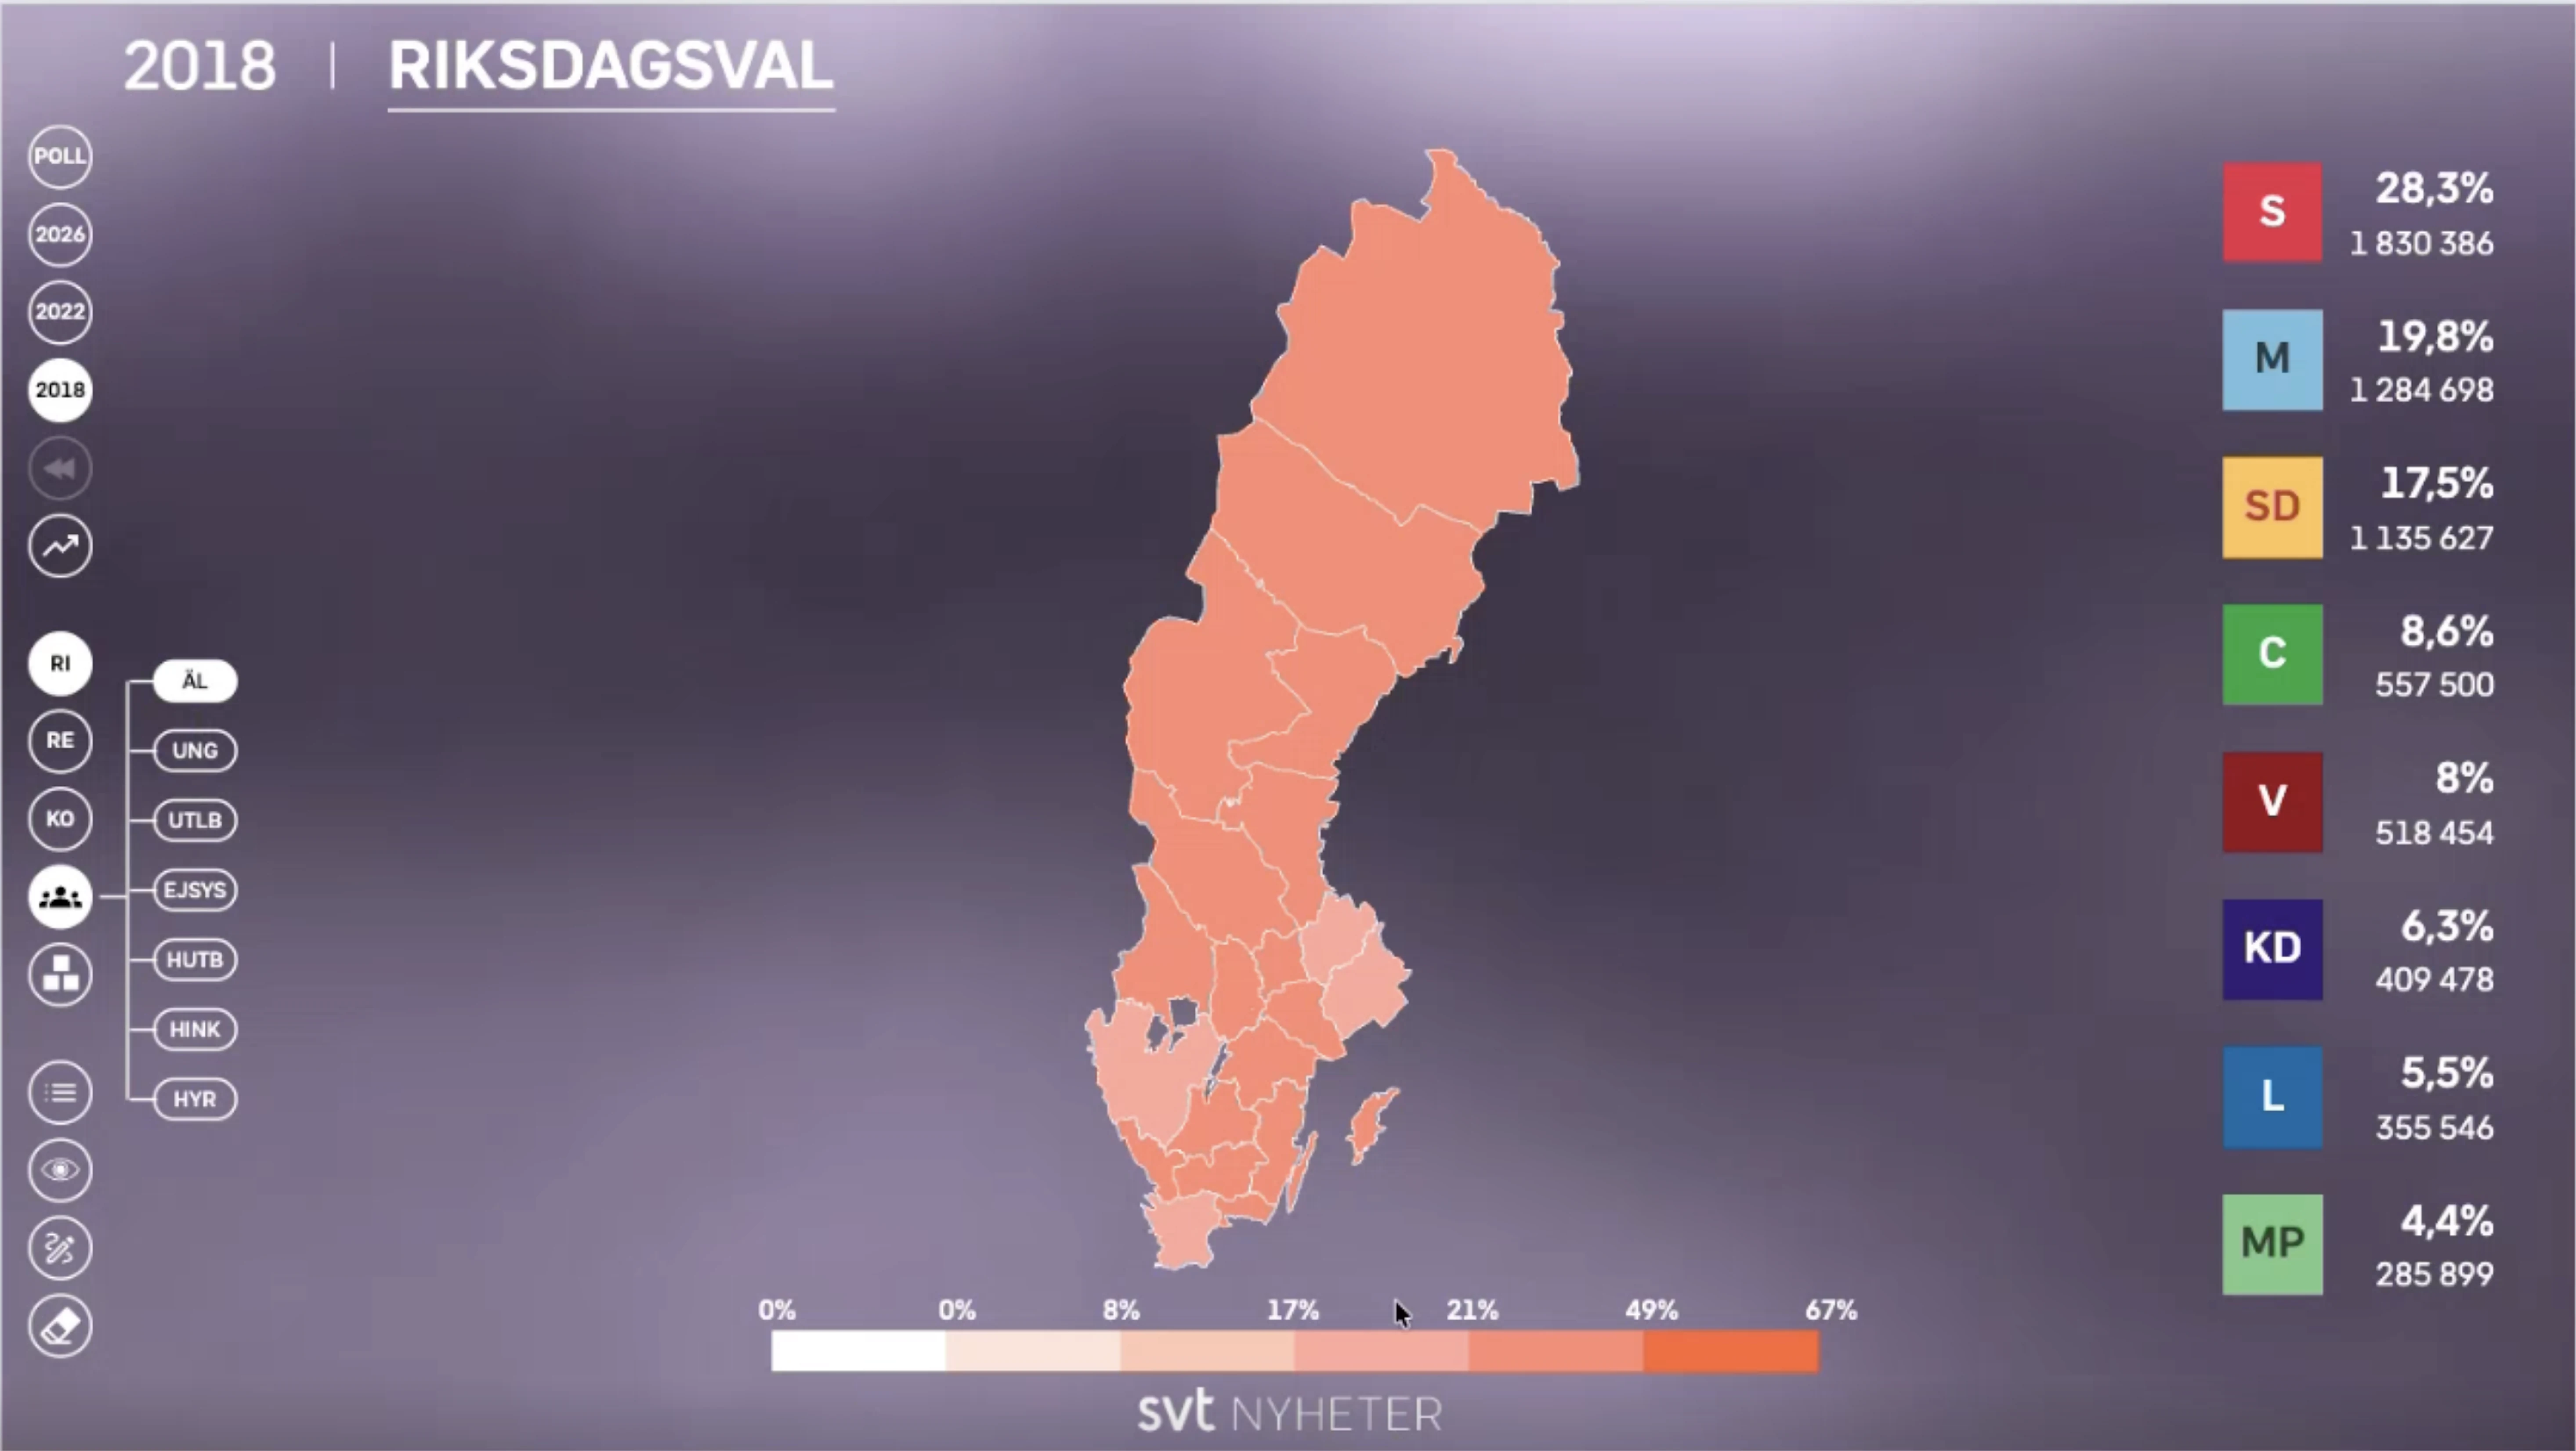
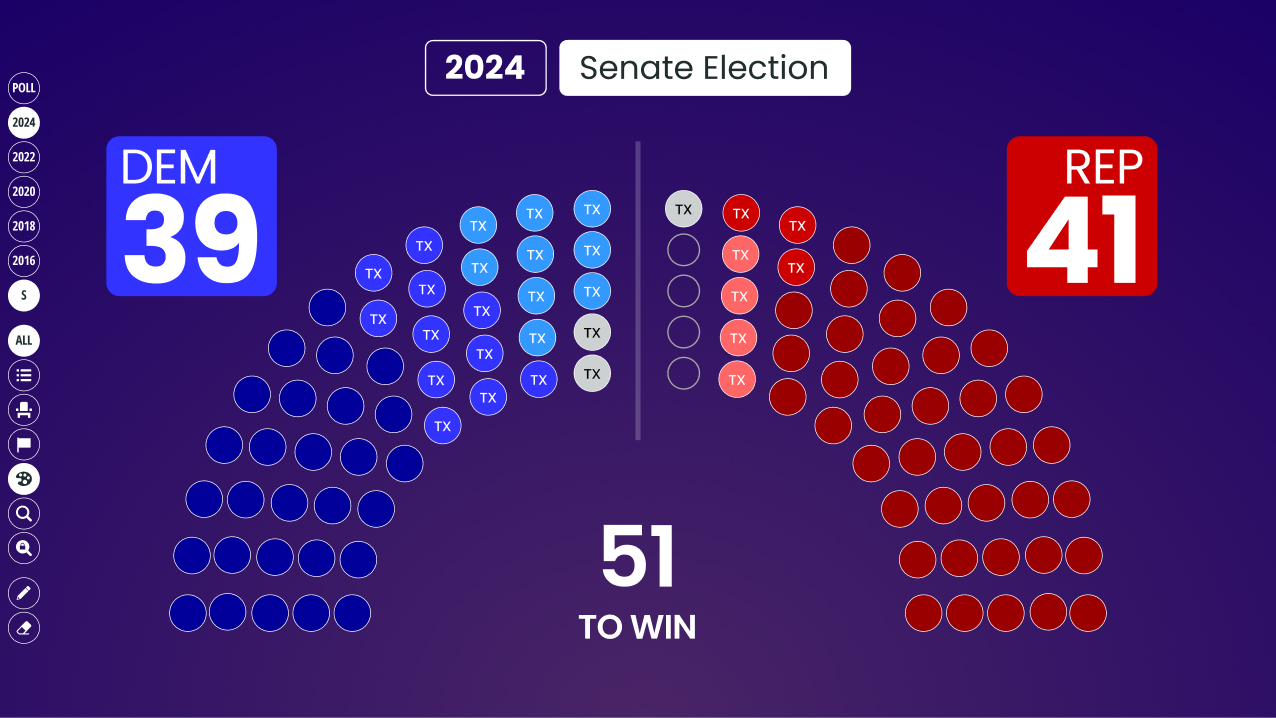
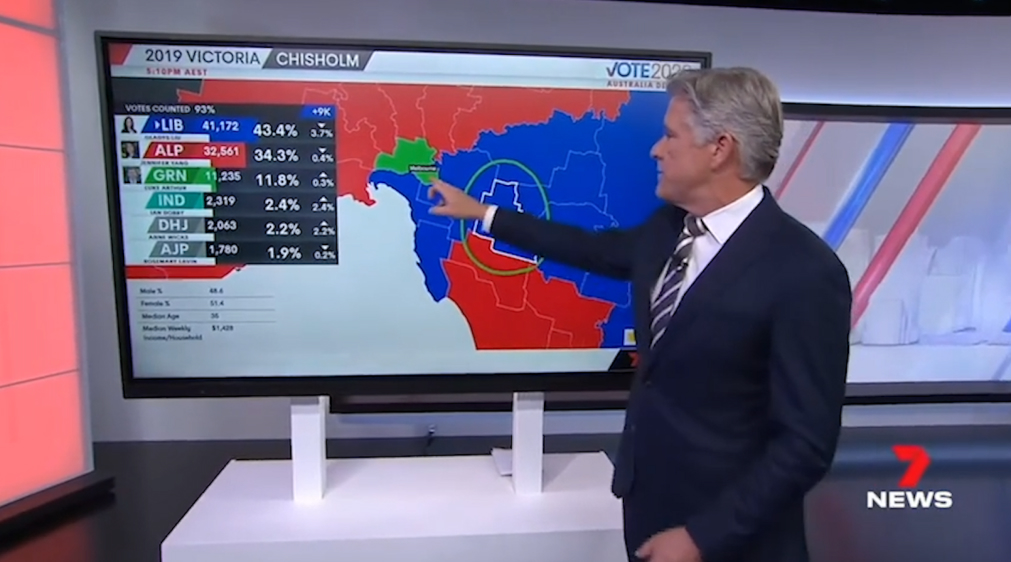
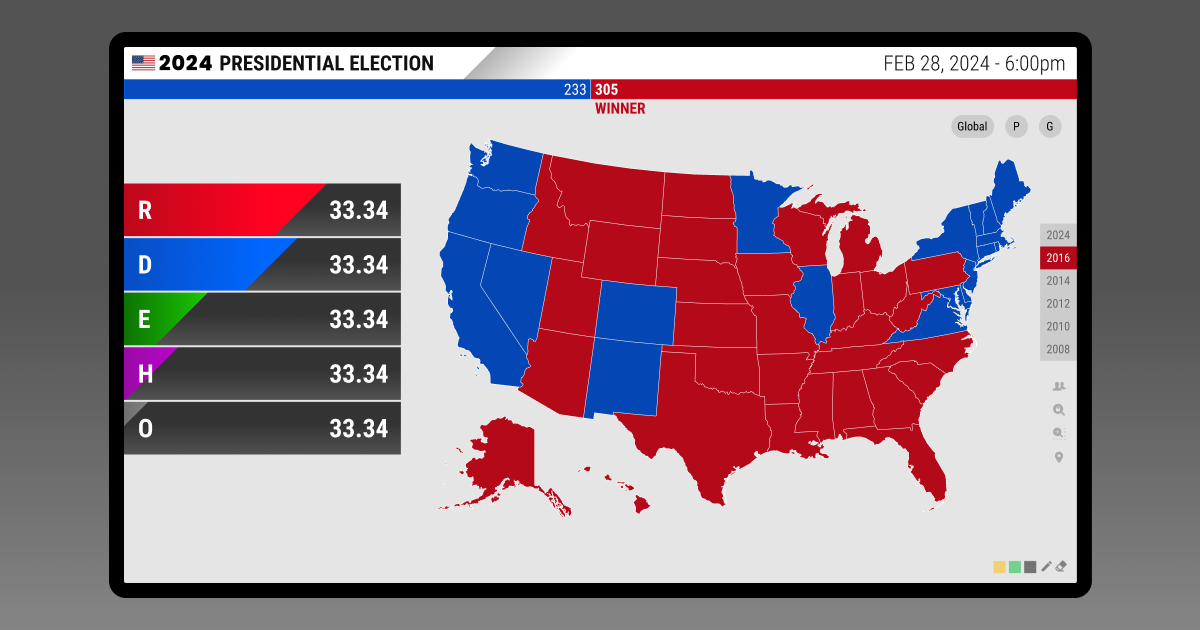
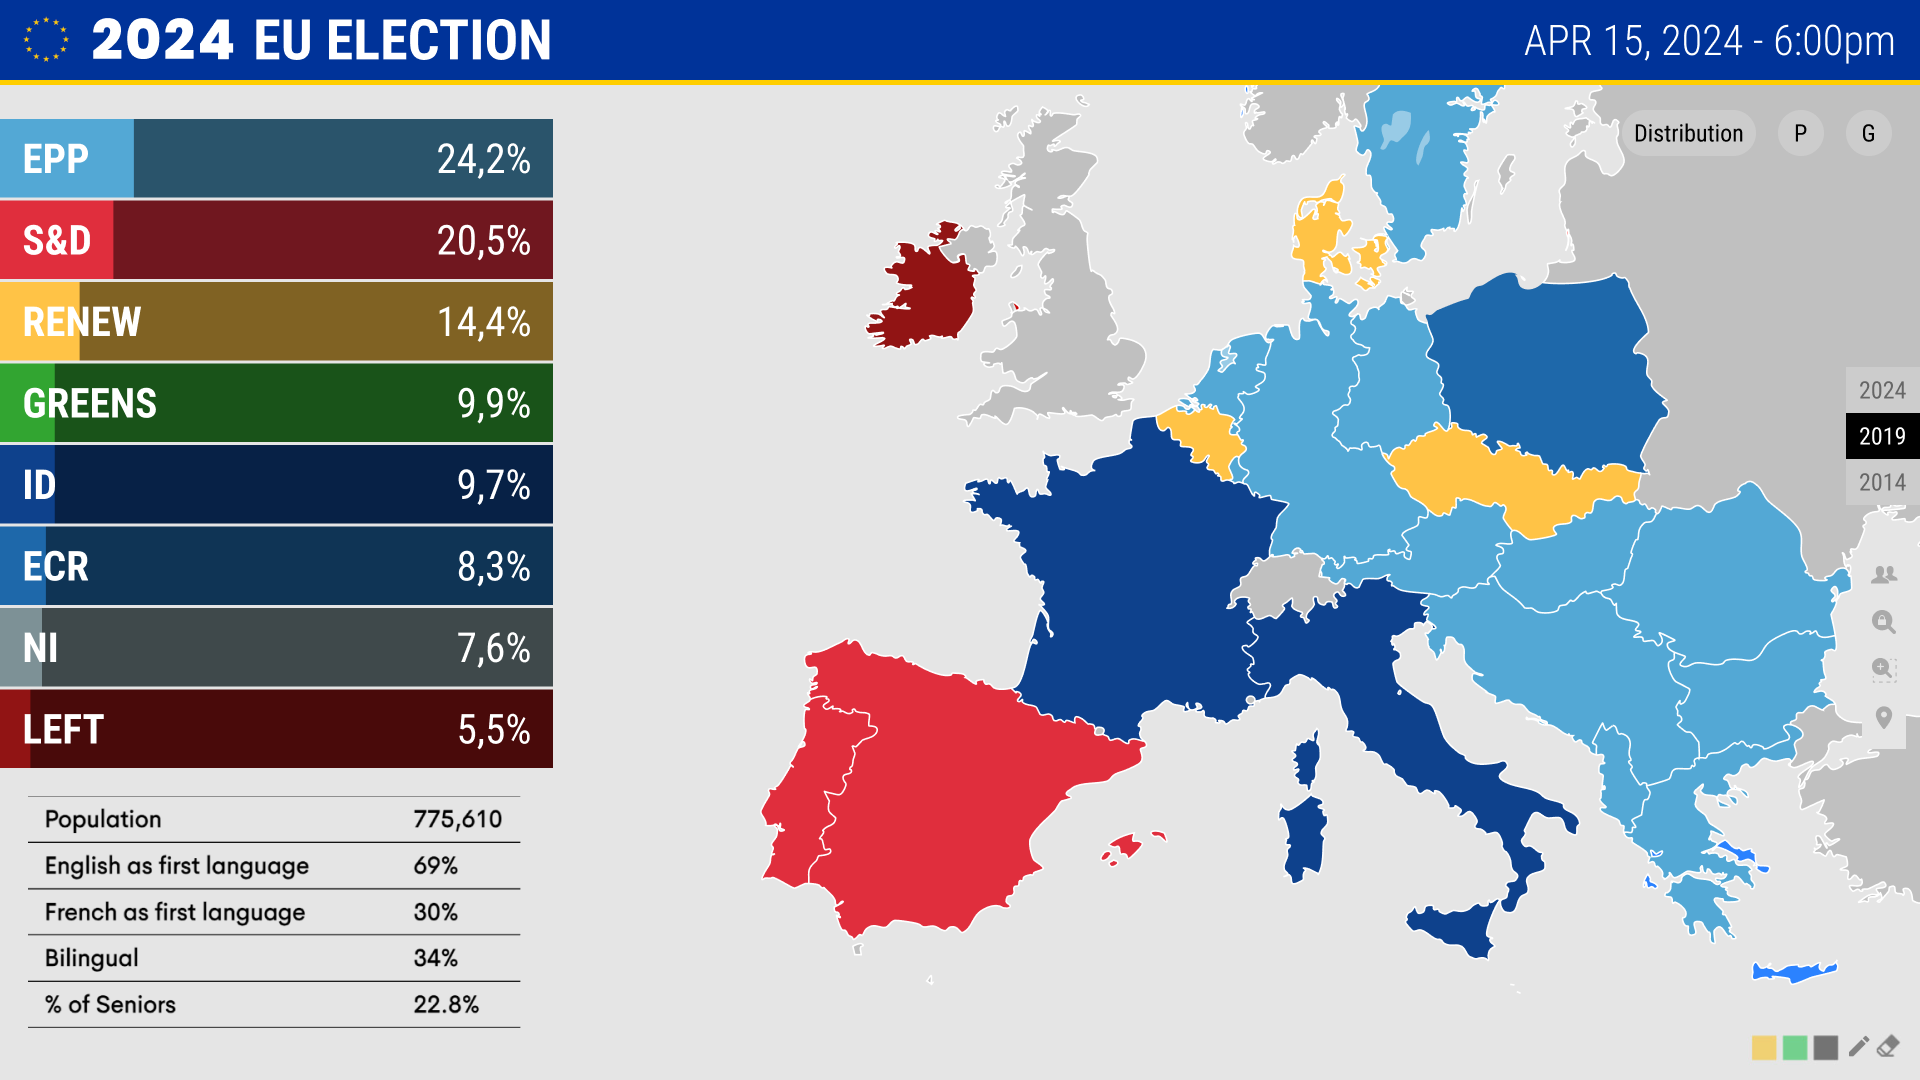
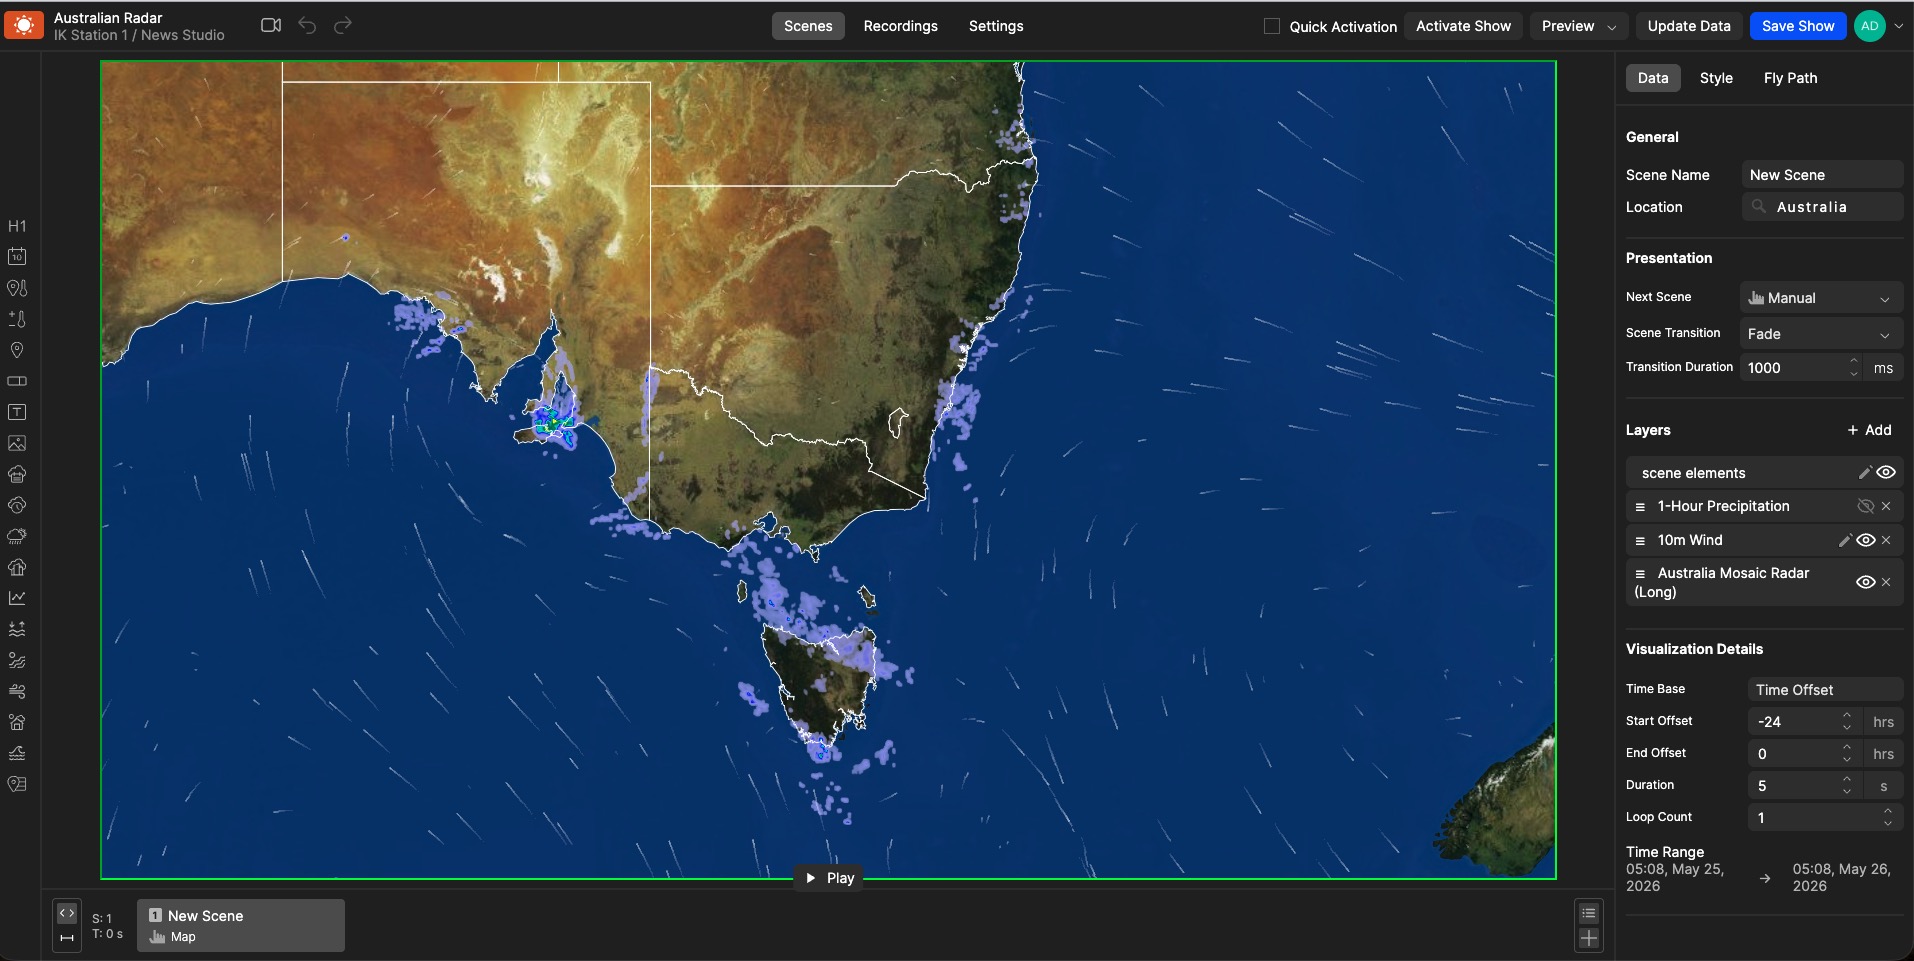
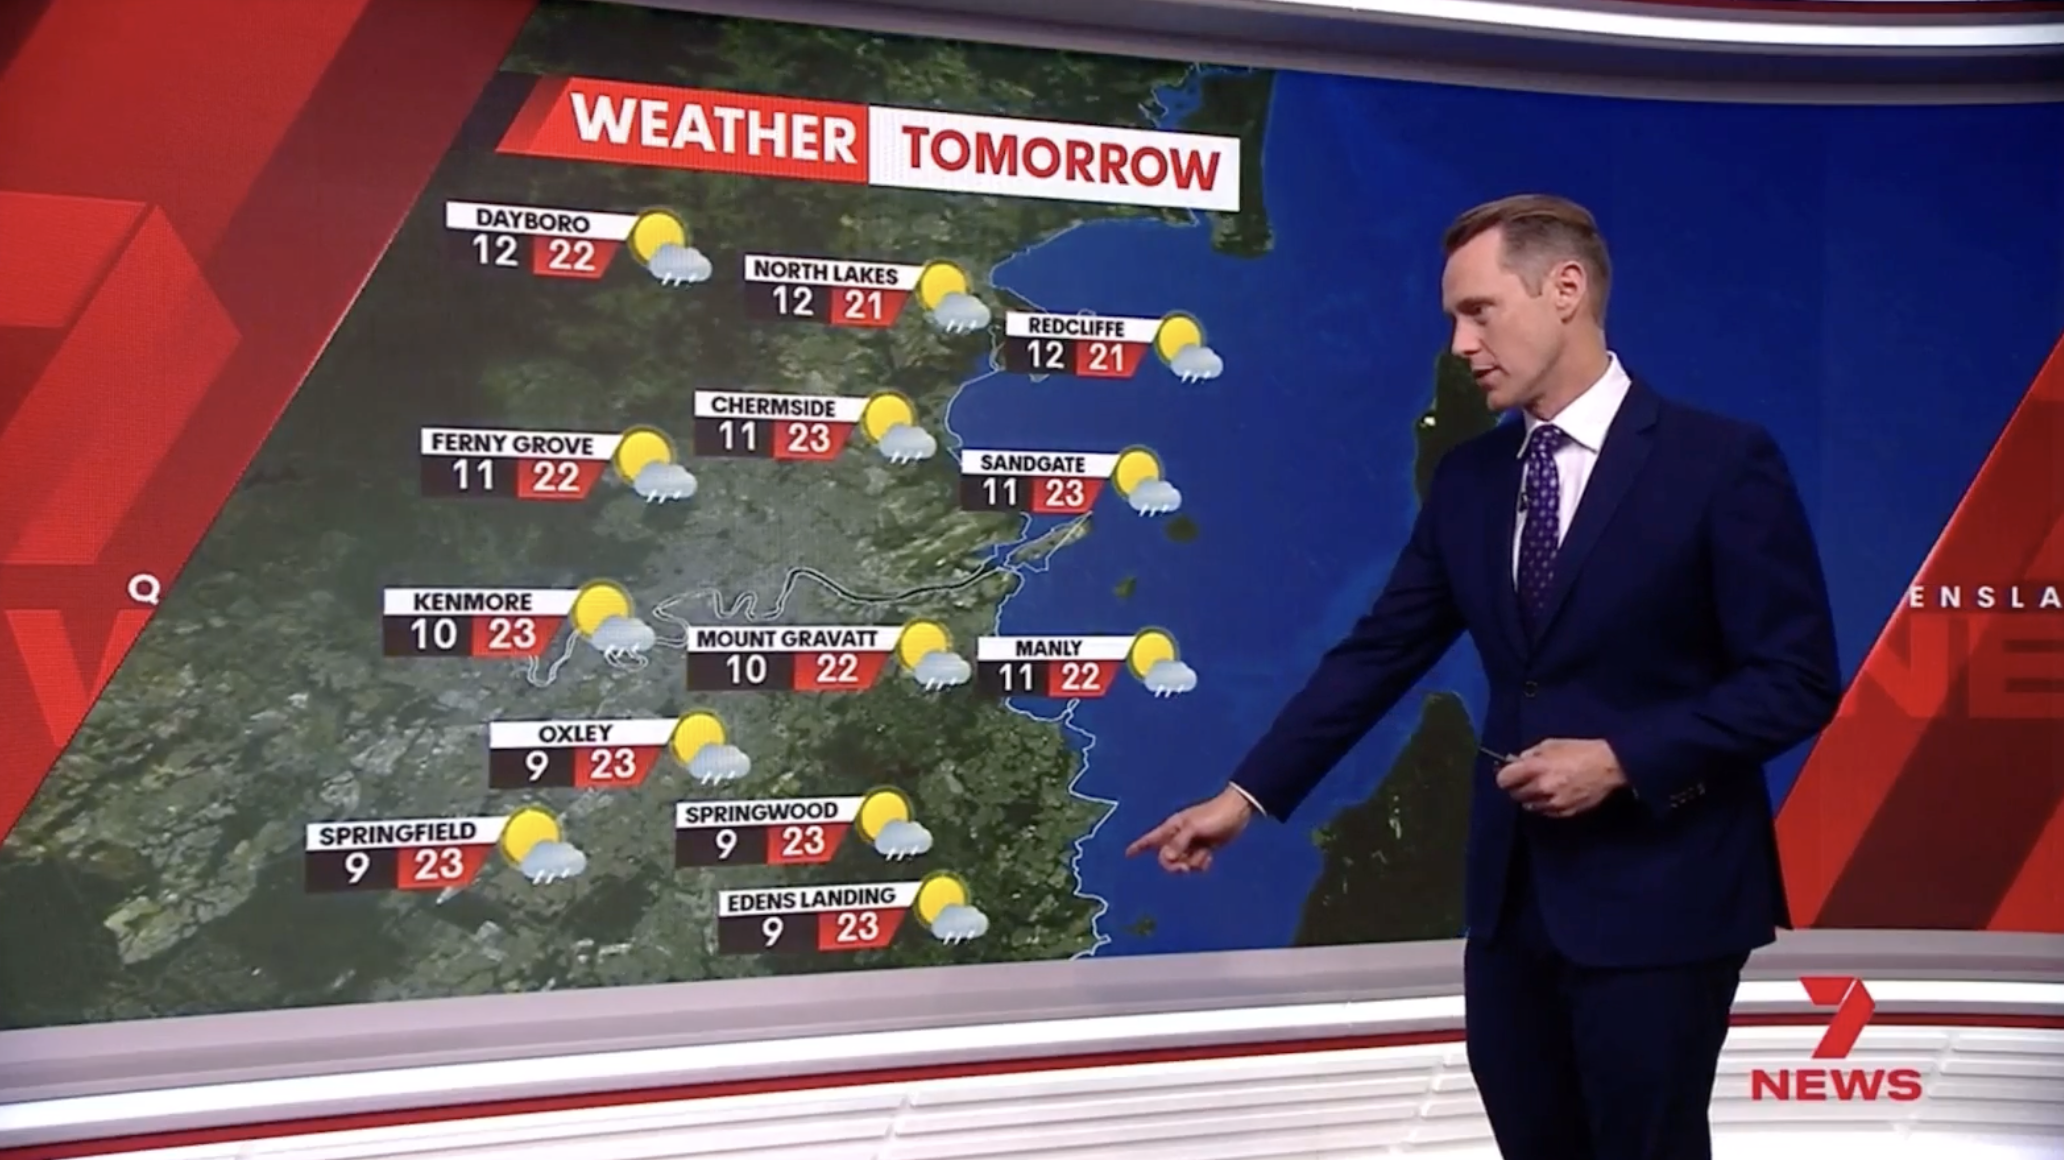
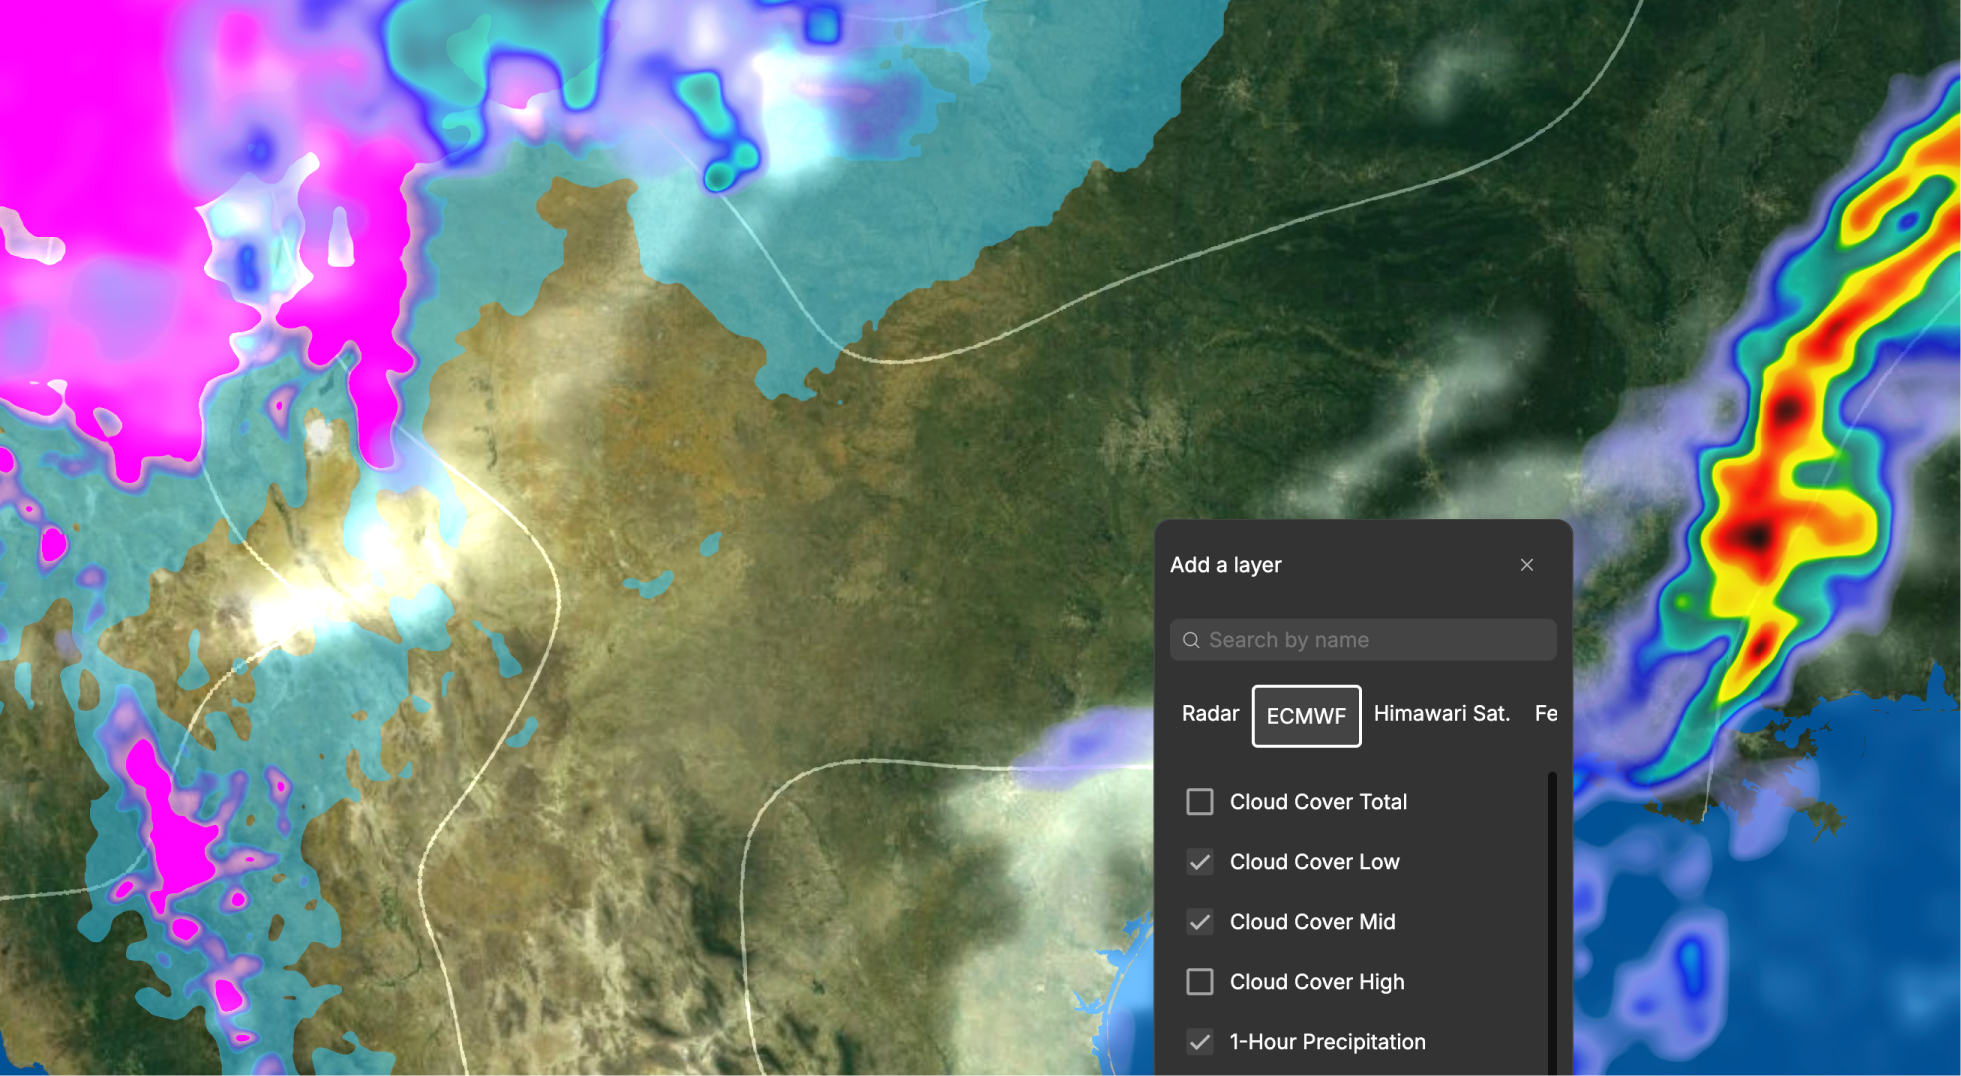
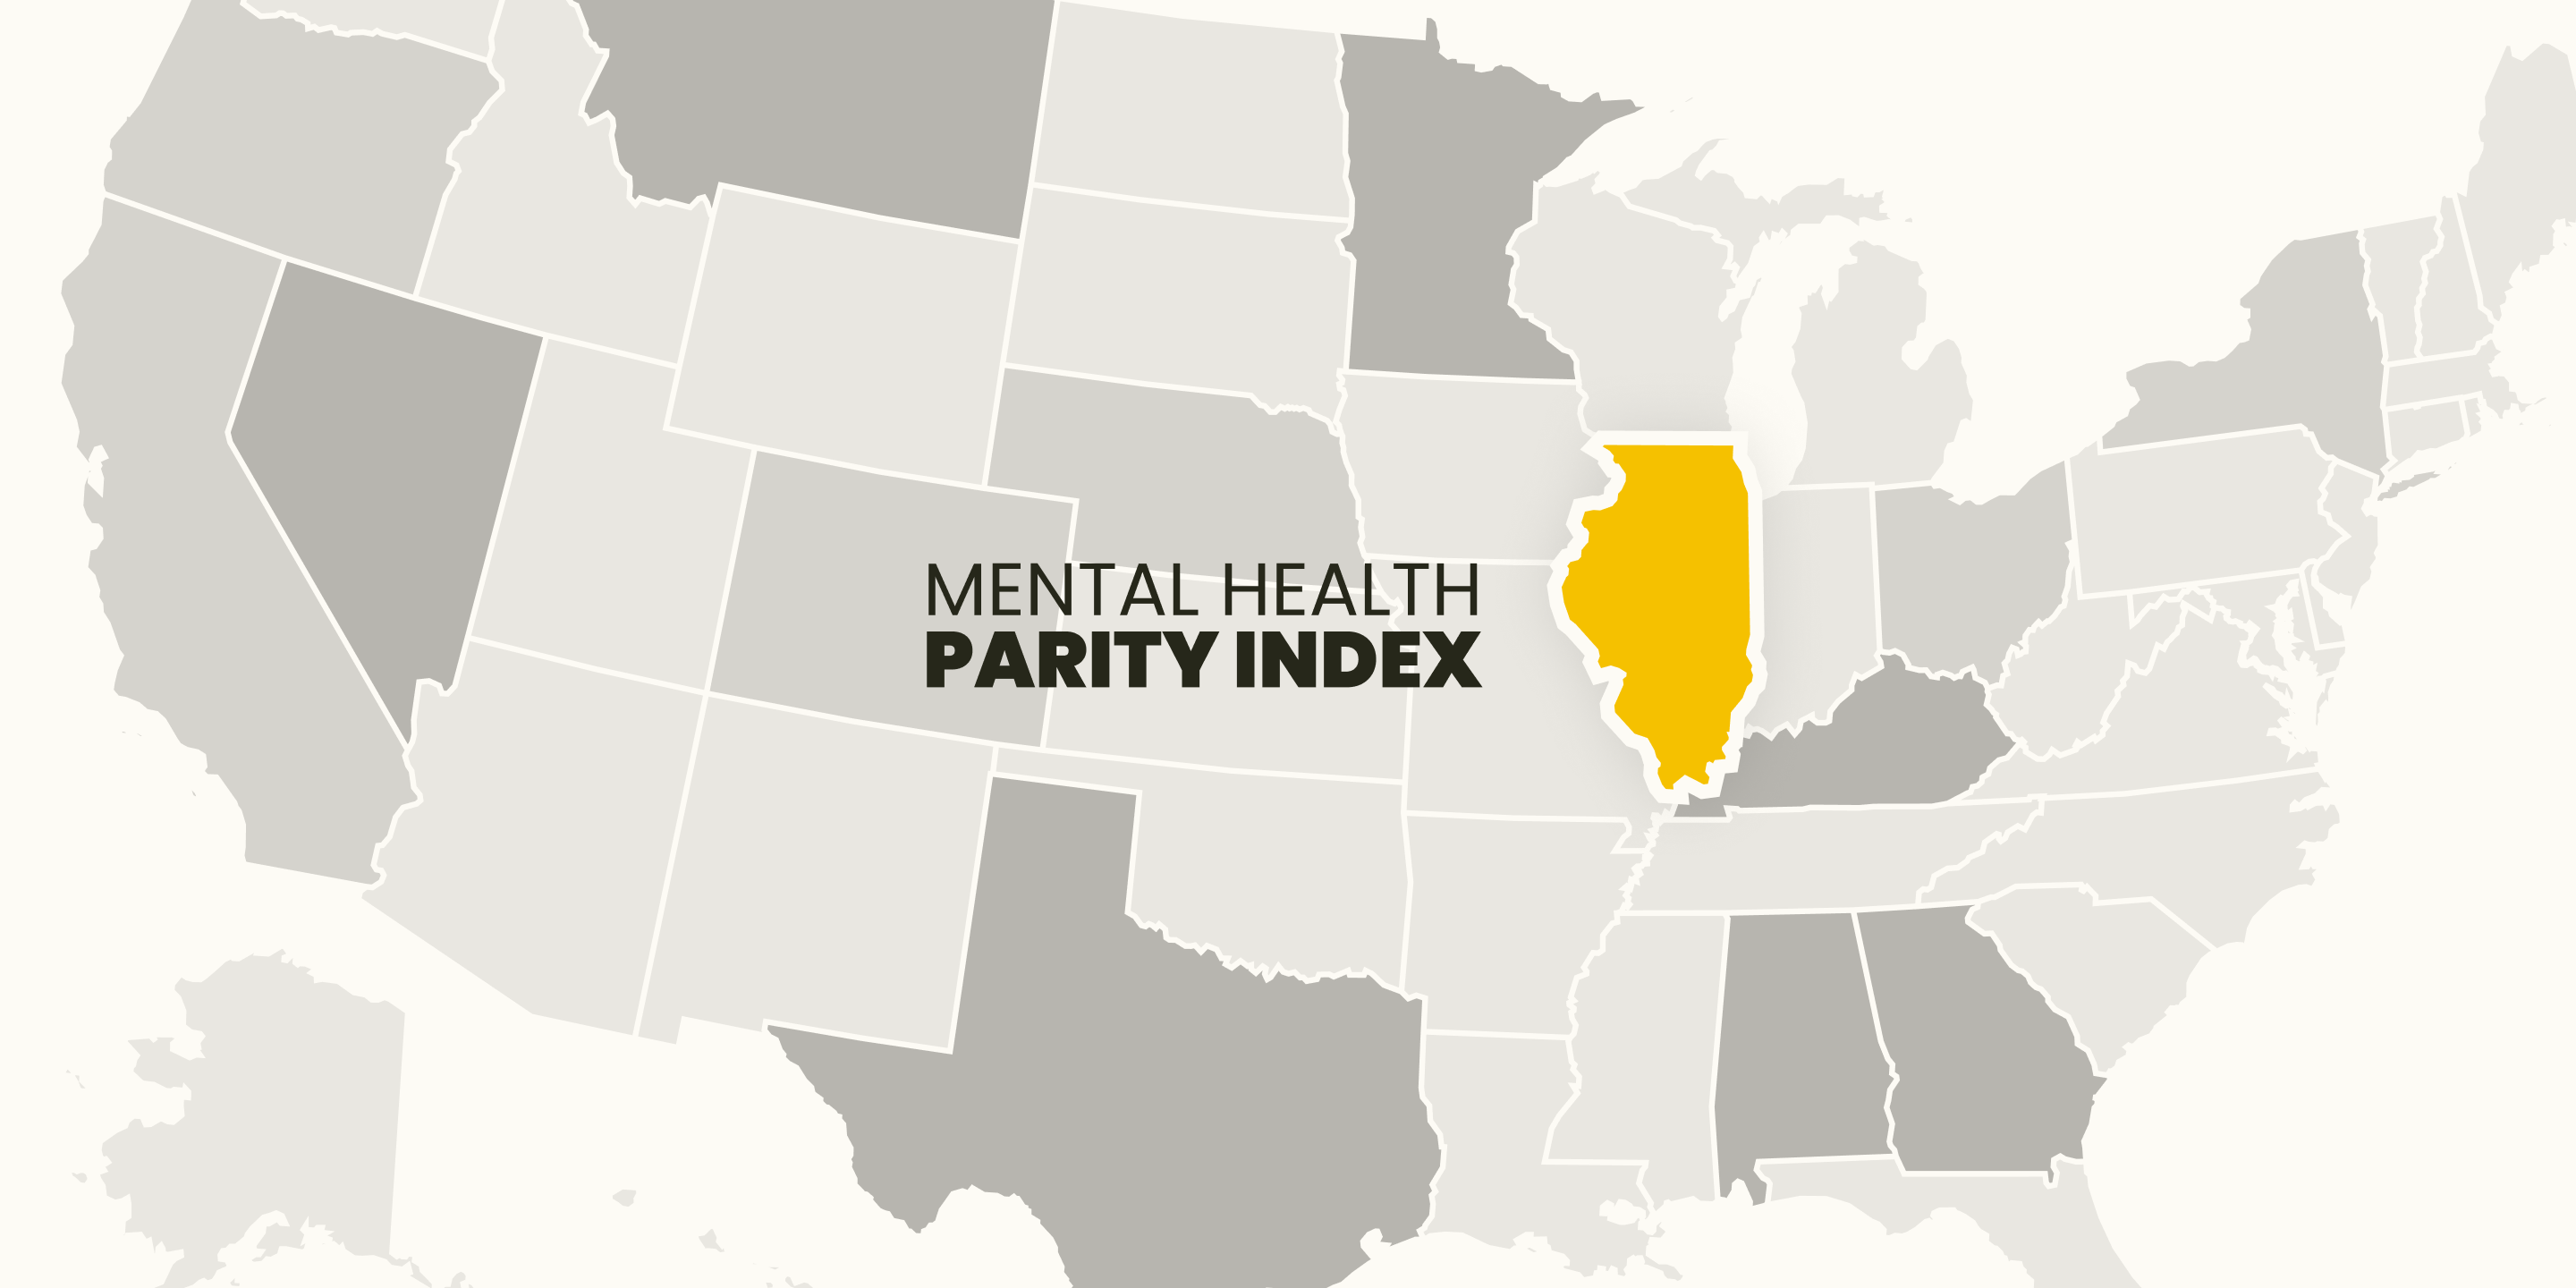
Data visualization is the practice of turning numbers into visual forms, such as charts, maps, and graphics, so people can understand patterns, comparisons, and changes at a glance. A table of 3,000 county results is hard to read. The same results shaded on a map show who is winning, and where, in seconds.