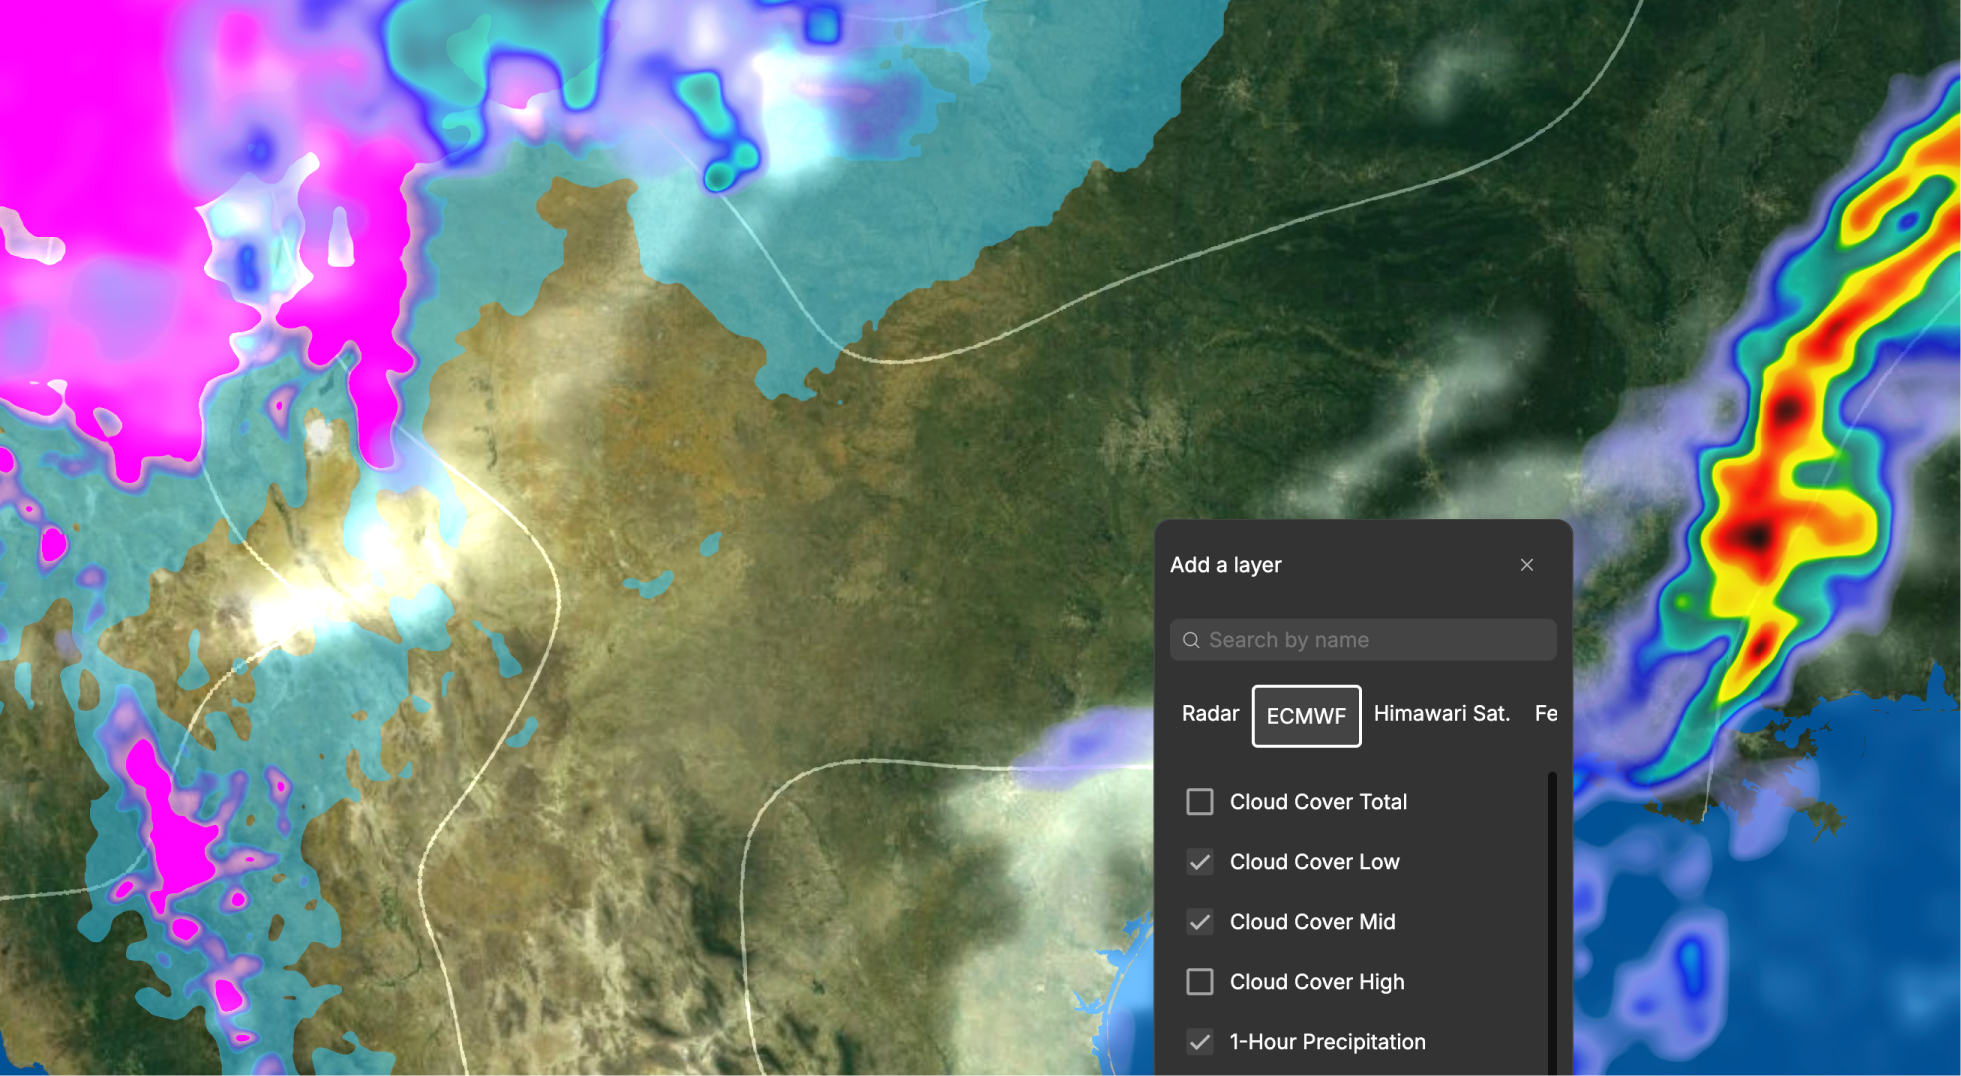
Data visualization is the practice of turning numbers into visual forms, such as charts, maps, and graphics, so people can understand patterns, comparisons, and changes at a glance. A table of 3,000 county results is hard to read. The same results shaded on a map show who is winning, and where, in seconds.
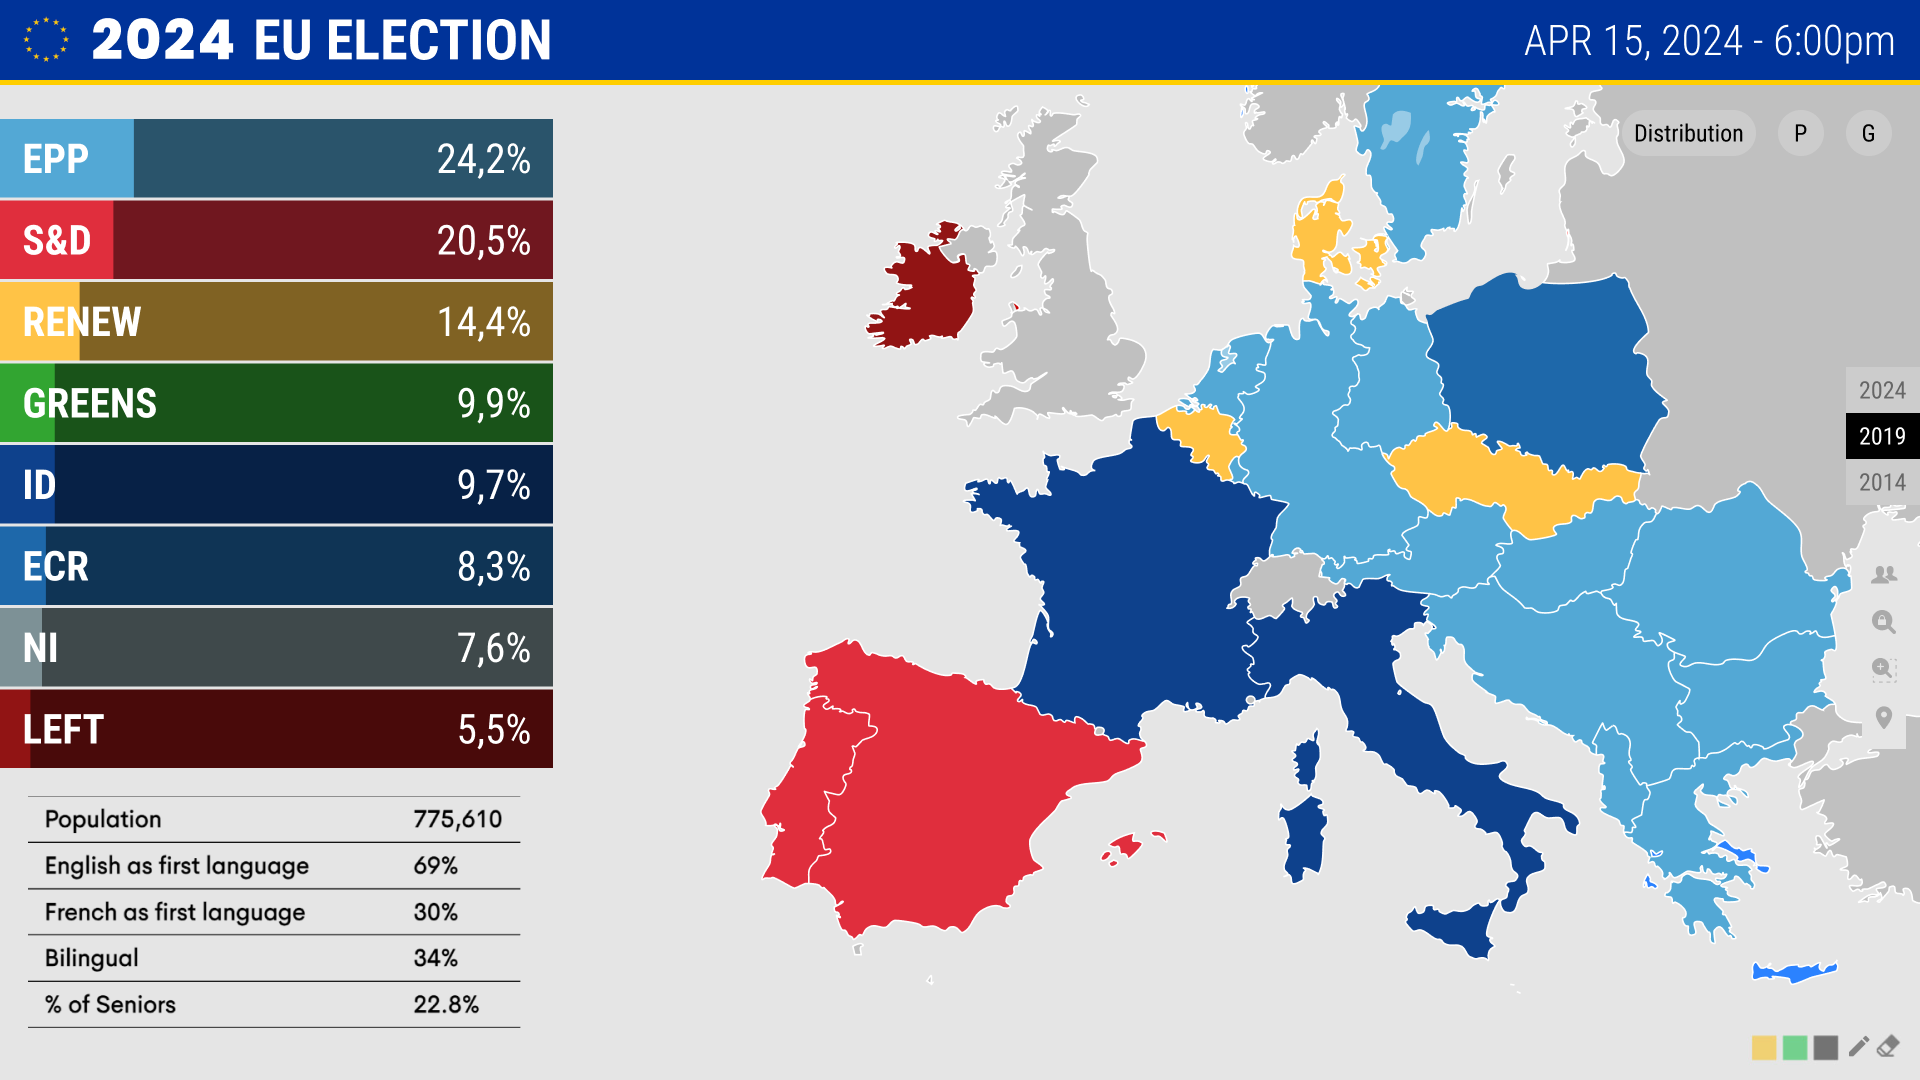
Data visualization is the practice of turning numbers into visual forms, such as charts, maps, and graphics, so people can understand patterns, comparisons, and changes at a glance. A table of 3,000 county results is hard to read. The same results shaded on a map show who is winning, and where, in seconds.
On television, data visualization has a constraint that a report or dashboard does not. The viewer gets a few seconds, cannot scroll back, and may be watching from across the room. That changes the rules:
As Cyrus Doomasia, Head of Delivery at InterKnowlogy, puts it: "You don't want to see a lot of data on the screen, because that overwhelms the end user. So we try to keep it as clean as possible so that you can get the story around it."
The two terms are related but not the same. Data visualization is the graphic itself. Data storytelling is the narrative a presenter builds around it: which number matters, why, and what happens next. On air, the strongest segments combine both.
Elections and weather are the two of the biggest data stories on television. In both, audiences tune in to understand something that affects them directly, and the visual is often what they remember. Clear visualization builds trust in the coverage. Cluttered or slow graphics erode it.
InterKnowlogy builds data visualization platforms for live broadcast: IK Election Insights and IK Weather Insights.