What is a seat projection?

A seat projection is an estimate of how many seats each party or candidate will win in a legislature, based on polling data or partial election results. It translates vote share, which is what polls and early counts measure, into seats, which is what decides who forms a government.
September 8, 2026

A seat projection is an estimate of how many seats each party or candidate will win in a legislature, based on polling data or partial election results. It translates vote share, which is what polls and early counts measure, into seats, which is what decides who forms a government.

Why vote share and seats are different

In most parliamentary systems, winning 40% of the vote does not mean winning 40% of the seats. The relationship depends on the electoral system:

  • First-past-the-post systems, such as Canada and the UK, award each seat to whoever wins the most votes locally. A small shift in national vote share can swing many seats.
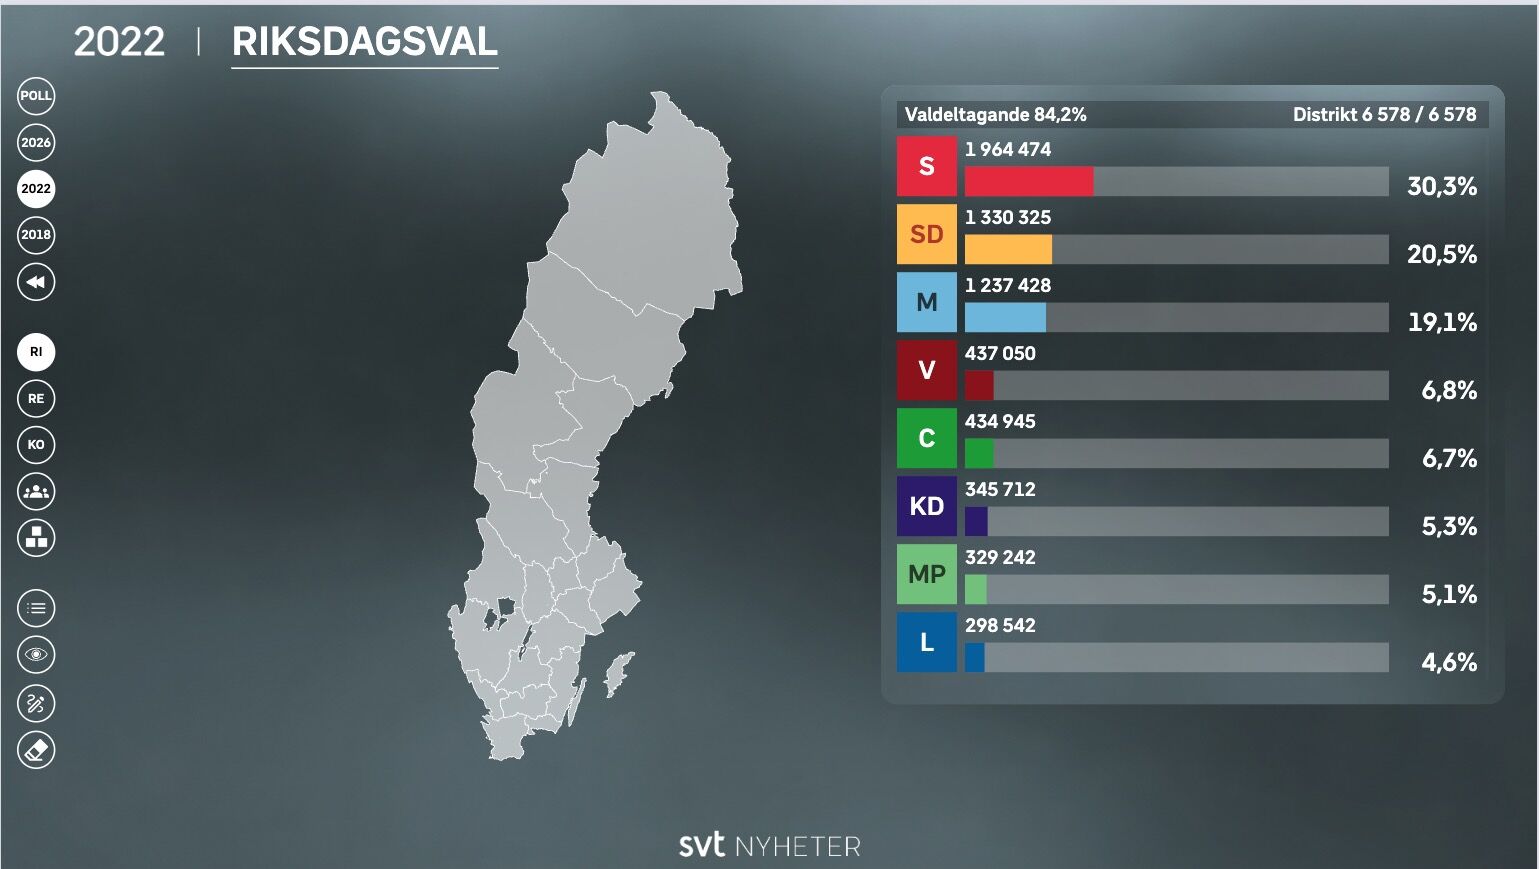
  • Proportional systems, such as Sweden, allocate seats according to vote share, but thresholds and allocation formulas still shape the result. A party just below a threshold can win no seats at all.

A seat projection applies the rules of the specific system to the available vote data.

How seat projections are built

  • Before election day, projections typically combine polling averages with past results by district, estimating how a regional swing would change each seat.
  • On election night, projections update as real results arrive. Early counts replace polling assumptions district by district, and the projection narrows as more votes are reported.

A projection is not a call. A call declares a winner in a specific race. A projection estimates the overall picture and comes with uncertainty, especially early in the count.

Seat projections on air

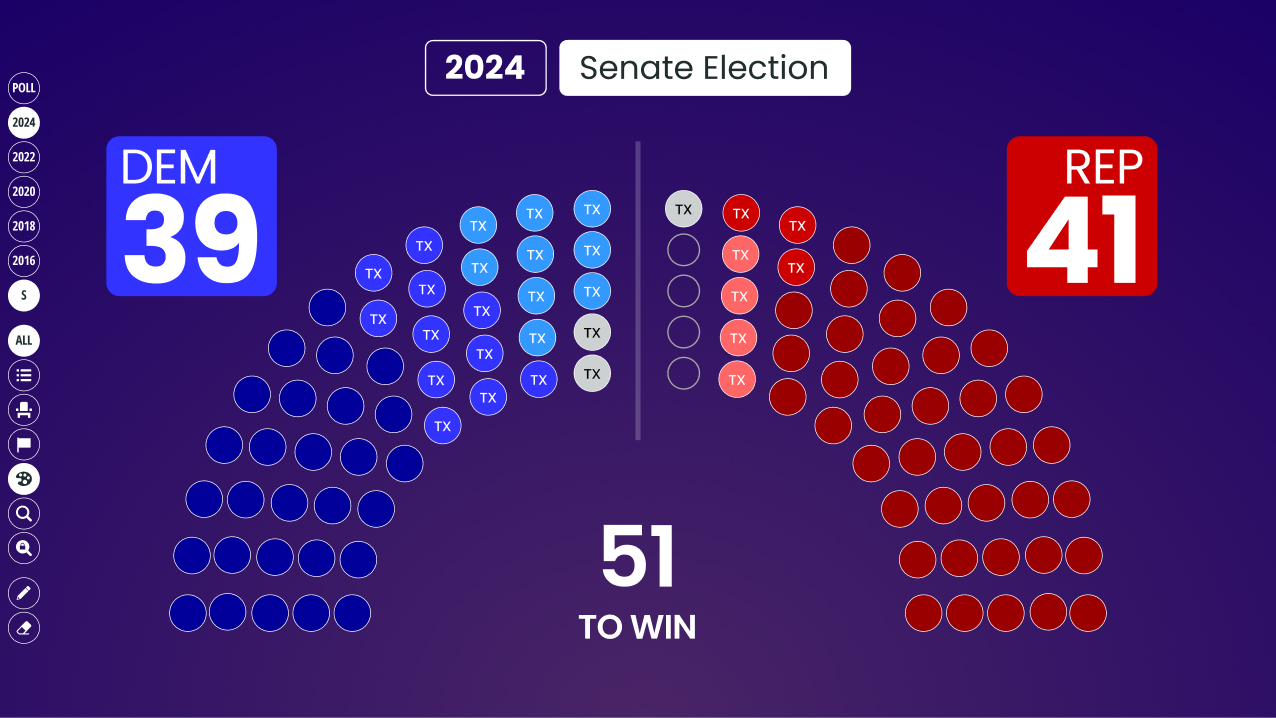
Broadcasters usually present seat projections as a seat count or a parliament chart showing each party's share of the chamber, often with a line marking the majority threshold. Analysts then use the projection to discuss what comes next: whether a party can govern alone, or which coalitions would reach a majority.

Why it matters for broadcasters

In parliamentary elections, the seat count is the headline. Viewers want to know who will govern, and a clear, live seat projection answers that question faster than district-by-district results alone. It also sets up the most watched analysis of the night: coalition scenarios.

Related terms

IK Election Insights includes live coalition and seat scenario modeling, used by SVT in Sweden to model government formation on election night.
Expert Insights

How to Choose Election Graphics Software for Broadcast

Choosing election graphics software for broadcast comes down to seven things: how it ingests data, how it performs under real-time load, how interactive it is on air, how fast it deploys, how it performs on election night, how redundant it is, and what its cost model actually looks like.
October 16, 2026

The Intrigue of Super Tuesday

The term “Super Tuesday” has existed since the 1970s—originally referring to the last big collection of primaries. Its modern usage was cemented in the 1980s, as many southern states moved their primaries earlier in the calendar to increase their influence in the process. Since then, as a rule, in both parties, a clear front-runner has emerged from Super Tuesday, often becoming the nominee.
Portrait of Matt DeCourcey
Matt DeCourcey
March 4, 2024

What Comes Next: Turning Insight into Action with the Mental Health Parity Index

Nathaniel Counts, Chief Policy Officer at The Kennedy Forum, shares how the Mental Health Parity Index is helping turn transparency into action—giving stakeholders a clear, shared view of where mental health coverage gaps exist, what it takes to achieve parity, and how the Index can expand to drive change nationwide.
Portrait of Pankaj Sood
Pankaj Sood
August 15, 2025